 Loading... Please wait...
九龍新蒲崗大有街25-27號中興工業大廈B座2字樓7室
Rm. 07, 2/F., Blk. B, Chung Hing Ind. Bldg., 25-27 Tai Yau St., San Po Kong
訂購熱線: 274 274 83
傳真: 274 274 93電郵: info@fordss.com
- Packing &Mailing Supplies
- Stretch Film
- OPP Packing Tapes
- Double-sided Tapes
- Masking Tapes
- Kraft Tapes
- Double-sided Foam Tapes
- Cloth Tapes
- Carton,Mail with paper tube
- Packing Paper
- Rubber Bands
- Nylon String Balls
- Plastic Packing Tape Dispensers
- Packing Machine & Accessories
- Price Labeller & Price Label
- Plastic Bag
- Tagging Gun & Accessories
- Mailing Supplies
- Office Machines & Accessories
- Scales
- Shredders & Accessories
- Checkwriters & Banknote Detectors
- Calculators & Accessories
- Electrnic Typewrite & Accessories
- Laminators & Accessories
- Binding Machines
- Time Recorders & Accessories
- Power Time Stamp/Accessories
- Electric Letter Opener
- Fax Machines
- Creasing Machines
- Printers
- Strapping Machines
- Electronic Labelling Machines & Tapes
- Projector Screens
- Plastic Bag Sealers
- Paper Folding Machine
- Stop Watch / Timer
- Hotmelt Glue Gun
- Computer Accessories
- Printer Supplies
- Fax Machines Ribbons
- CD holder/Pockets
- CPU Stand
- Portable Speaker
- Notebook Security Numerical Lock
- Copyholder
- Cleaning Supplies & Other
- Mouse/Wrist Pad
- Backrest
- Foot Rests
- Privacy Screen Filter / Blue Light Cut Screen Filt
- Moniter Riser
- Keyboard Drawer
- Mouse/Keyboard
- Digital Storage Media
- Extension Leads
- Laptop Cooling Pad
- Card Reader
- USB HUB
- Laser Pointer
- Headset
- Other
New Products
Our Newsletter
- Home
- Office Machines & Accessories
- CASIO FX-CP400 Releases Graphing Scientific Calculator
- Home
- Office Machines & Accessories
- Calculators & Accessories
- CASIO FX-CP400 Releases Graphing Scientific Calculator
- Home
- Scientific Calculators
- CASIO FX-CP400 Releases Graphing Scientific Calculator
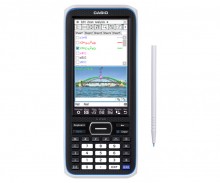
CASIO FX-CP400 Releases Graphing Scientific Calculator
Product Description
Features

∗ Comes with snap-on hard case
Vivid Color Display and Touch Panel for Superb Usability
Horizontal Screen View

Display long formulas on a single line.
Beautiful 4.8-inch color display

©Phillip Minnis-Fotolia.com
The display has resolution of 320 x 528 pixels (more than 65,000 colors), 4.4 times higher than ClassPad 330 PLUS.
Pen-touch Operation

Quickly and easily create graphs using drag and drop.
Simple interface

Main menu

Toolbar

Menu bar

Interactive interface
Touch-panel operation by stylus or finger
The fx-CP400 offers intuitive stylus touch-panel operation that eliminates complicated key operations. Graphically display mathematical formulas by simply dragging and droppingthem into the graph area.
Create a graph by selecting a formula
and using drag and drop.

Brand-new software keyboard

Computer Algebra System (CAS)

Laplace transforms

Fourier transforms
The CAS supports everything from Expand, Factor, Solve, and other basic commands to advanced commands like Fourier and Laplace transforms.
eActivity application

Graph & Picture

Select the formula for the graph you want to create.
![]()

A graph screen with a visual appropriate for creating a graph of the selected function is displayed.

Congratulations! Your graph is complete.
![]()

Change the graph by repeatedly changing coefficient to create a graph that visually matches the parabola.
C2P files — Single images
Plotted C2P files can be used in Graph & Table, eActivity, Conics, Sequence, and Statistics.

©styf - Fotolia.com

©Phillip Minnis - Fotolia.com

©spinskin - Fotolia.com

©Steve Beckle - Fotolia.com

©Olivier G - Fotolia.com

©Juha-Pekka Kervinen - Fotolia.com
More than 40 pictures are pre-loaded on the fx-CP400!
Graphing function

Area of inequality shading,
grid lines, numbers on axes

A different color for
each graph and figure

∫dx intersection
Geometry

Geometric graphing

Geometric graphing using drag & drop
Spreadsheet application

Color Link
The fx-CP400 features the Color Link function, which automatically links colors specified on the spreadsheet screen with colors used in graphs to support learning of functions by enabling visual confirmation of changes in values or trends.
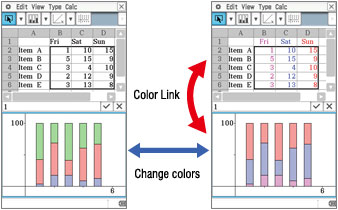
Use Color Link to link the color of text and graphs.
Differential Equation Graph application

Financial application
This fx-CP400 application provides a total of 15 different financial calculations,including simple/compound interest, cash flow, amortization, depreciation, bondcalculation, and operating/financial leverage.

Specifications
ALGEBRA
- CAS (Computer Algebra System)
- Algebra Assistant
- Fractions
- Transformation (simplify, expand, factor)
- Function graphing, polar, parametric and x = f (y) equations
- Numeric evaluation of functions in tables
- Graph solve (root, max, intersection, inflection, distance)
- Conics graphs (Parabola, Circle, Ellipse, Hyperbola, General figure)
- Conics graph solve (Focus, Vertex, Directrix, Symmetry, Center, Radius)
- Recursive and explicit sequence numerical tables and plots
- Number Base (base 2 (Bin), 8 (Oct), 10 (Dec) and 16 (Hex))
- Laplace transform, Fourier transform, Fast Fourier transform (FFT)
CALCULUS
- Hyperbolics
- Integration, Differential
- Differential equation
- Σ, ∏, lim
- Dirac Delta, Heaviside Unit Step, Gamma
STATISTICS
- Statistical plot (Scatter Plot, xyLine, Normal Probability Plot, Histogram, Box-whisker plot)
- Statistical regression graphs
GEOMETRY
eACTIVITY APPLICATION
HARDWARE
- Data communication (via USB and 3-pin cables)
- USB cable for connecting with PC
- 3-pin cable for connecting with other ClassPad unit or EA-200
OTHER USEFUL FEATURES
- Graphing function
- Drag & drop
- Natural format input of equations and expressions
- Natural format display of results
- Math, Alphabet, 2D soft keyboards
- Command catalogue soft keyboard
- Shift key configuration
- Calculation History
- Mantissa + exponent: 10 + 3
- Interactive manipulation for solving equations
- Differential equation graphs
- Numeric equation solver
- Financial calculations
- Icon menus
- Full screen display/Split screen display
- Software upgradeability (maintenance, feature upgrades)
- User-defined variable
- User-defined function (extends built-in functions)
- Folder-based memory management
- Resetting/Initializing memory
- Selectable display language
- Auto Power Off (APO)
- Bundled Screen Receiver Software
- Ending Screen/User-defined Ending Screen
- Graph & Picture
- Horizontal screen view
- Length unit
OPTIONS
- ClassPad Manager (FA-CP400A/B)
- EA-200 Data Analyzer
-
USB direct connection to CASIO Data Projector ∗
∗ For information on supported models, refer to the following URL:
http://edu.casio.com/support/projector/en/

-
Simple data management using the mass storage function

Specifications
-
Color display
-
Dot matrix displayHigh-resolution screen provides beautiful looking graphs every time.
-
Icon menuSpecify the operation you want to perform by selecting an icon or inputting a number.
-
Multi-replayQuick and easy recall of previously executed formulas for editing and re-execution.
-
Plastic keysDesigned and engineered for easy operation.
-
List based STAT-data editorViewing and editing of input data in list format, showing data groups (x-data, y-data, frequency) and surrounding data.
-
Data communication with a personal computerAllows data communication with a personal computer.
-
Natural textbook displayDisplay expression same as textbook.
-
10 + 3 digits10-digit mantissa + 3-digit exponential display.
